Boost your data accuracy and identify ratio mismatches instantly with the Sample Ratio Mismatch Calculator. Perfect for statistical error detection, data validation, and enhancing predictive data analysis.
📊 Sample Ratio Mismatch Calculator
✅ SRM Check Result
What Is a Sample Ratio Mismatch (SRM)?
A Sample Ratio Mismatch (SRM) occurs when the actual traffic distribution between your A/B test variants does not match the expected ratio. For example, if you expect a 50/50 split but the real data shows 60/40, that’s a clear indication of a mismatch. This issue can make your A/B testing results unreliable, reducing the accuracy and trustworthiness of your experiment outcomes.
The concept of a Sample Ratio Mismatch is crucial in data-driven marketing and conversion rate optimization because it directly affects the validity of A/B testing. When an SRM occurs, your audience is not being evenly distributed across test variations, which can lead to biased conclusions and incorrect business decisions. Common causes include tracking errors, randomization bugs, and uneven traffic allocation from testing tools. Identifying SRM early helps maintain the integrity of your experiment data and ensures that your performance metrics remain statistically sound.
In simple terms, a Sample Ratio Mismatch means your A/B testing setup is not balanced correctly. Using a reliable Sample Ratio Mismatch Calculator allows you to quickly detect and fix these issues before analyzing your test results. This helps maintain consistent accuracy, improves test performance, and ensures your decisions are backed by clean, unbiased data.
Why Detecting SRM Is Important in A/B Testing
Detecting a Sample Ratio Mismatch (SRM) is one of the most critical steps in ensuring your A/B testing accuracy. When SRM goes unnoticed, your experiment results may become unreliable and misleading. The entire purpose of A/B testing is to make data-driven decisions, and that requires both versions of your test to receive traffic exactly as planned. Without detection, the test loses its statistical foundation and cannot provide trustworthy insights.
The importance of identifying SRM lies in maintaining the integrity of your experiment data. An undetected Sample Ratio Mismatch can cause false positives and lead to the wrong version being declared as a winner. In large-scale conversion optimization programs, this can result in wasted resources, lost revenue, and poor business decisions. By regularly using a Sample Ratio Mismatch Calculator, you can detect traffic imbalances early, validate your test setup, and ensure your statistical significance remains accurate throughout your experiments.
In short, detecting SRM keeps your A/B testing results clean, credible, and scientifically valid. It helps marketers, analysts, and developers trust the insights they gather from experiments. The more consistently you monitor for SRM, the more confident you can be in your data analysis and overall testing strategy.
How to Use the Sample Ratio Mismatch Calculator
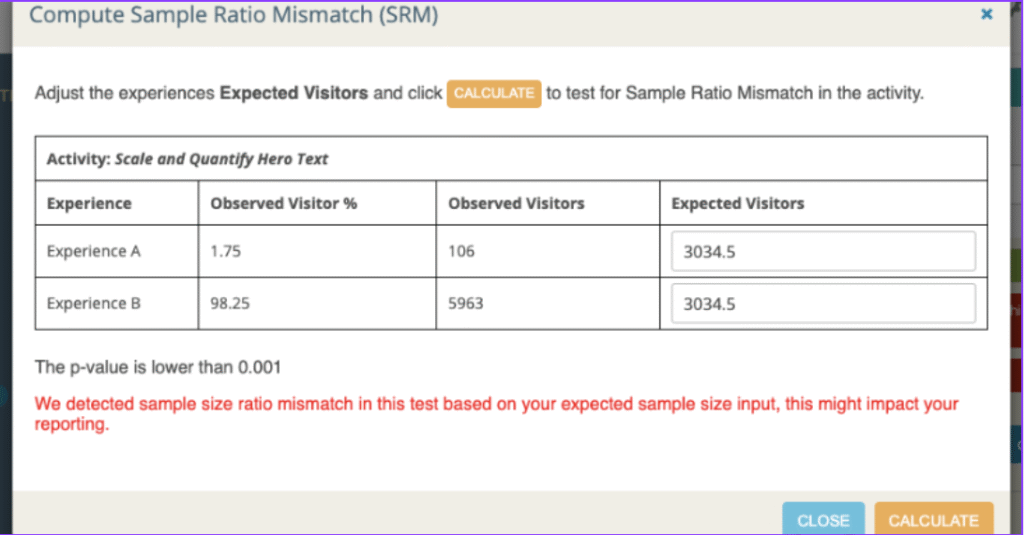
Using a Sample Ratio Mismatch Calculator is simple yet essential for anyone running A/B tests. This online tool helps you identify whether your experiment traffic has been distributed according to the expected ratio. The process requires you to input both your expected traffic percentage and your actual visitor count for each test variation. Within seconds, the calculator reveals if a Sample Ratio Mismatch (SRM) exists in your data.
To get accurate results, start by entering the expected allocation, such as 50% for Variant A and 50% for Variant B. Then, add the real numbers of visitors each variant received. Once you click the Calculate button, the SRM Calculator runs a statistical test, usually a Chi-Square analysis, to determine if the difference between expected and actual samples is significant. If the calculator indicates a mismatch, it means your A/B testing setup may be unbalanced and needs review before making final conclusions.
By consistently using the Sample Ratio Mismatch Calculator, you can ensure your experiments are fair and data is valid. It’s a quick, reliable, and professional way to detect potential issues that could compromise your test accuracy. This proactive step saves time, enhances credibility, and strengthens your overall testing strategy.
Sample Ratio Mismatch Formula
The Sample Ratio Mismatch Formula is based on the Chi-Square statistical test, which helps determine whether the difference between your expected and observed traffic ratios is significant. In an ideal A/B test, the number of users assigned to each variation should match the intended split. When that doesn’t happen, the formula identifies if the mismatch is random or a sign of a deeper tracking issue.
The mathematical expression for detecting a Sample Ratio Mismatch (SRM) is given as:
χ² = Σ ((Oi − Ei)² / Ei)
Here, Oi represents the Observed sample count (actual traffic received by each variation), and Ei is the Expected sample count (planned traffic distribution). If the resulting p-value is less than 0.05, it indicates a Sample Ratio Mismatch exists. This means the traffic allocation in your A/B testing tool is likely uneven, and your test results may not be statistically valid.
Using this SRM formula helps ensure your data accuracy and protects against false conclusions. Incorporating it into your testing workflow allows you to quickly verify the balance of traffic and maintain high-quality, reliable experiment results.
Example Table for SRM Calculation
To understand how a Sample Ratio Mismatch Calculator works in practice, let’s look at an example using a simple A/B testing experiment. In this example, we expected a 50/50 traffic split between Variant A and Variant B, but the actual visitor data tells a different story. The table below shows the expected visitors, actual visitors, and the computed value for (O−E)² / E, which is used in the SRM formula.
| Variant | Expected Visitors (E) | Actual Visitors (O) | (O−E)² / E |
|---|---|---|---|
| Variant A | 5000 | 5400 | 32.0 |
| Variant B | 5000 | 4600 | 32.0 |
| Total χ² | 64.0 | ||
As shown in the table, the Chi-Square value (χ²) is 64.0. Since this value is much higher than the critical value of 3.84 for a 95% confidence level, it indicates a clear Sample Ratio Mismatch (SRM). This means your A/B testing data is not properly balanced, and you should review your experiment setup before trusting the results.
Using such examples inside your SRM analysis helps visualize traffic imbalance and makes it easier to identify testing errors. It’s a simple yet powerful way to ensure the accuracy of your conversion experiments and maintain a high level of confidence in your data insights.
Common Causes of Sample Ratio Mismatch
A Sample Ratio Mismatch (SRM) often happens when there is a difference between how traffic is expected to be divided and how it is actually delivered in an A/B testing experiment. This issue can arise from multiple technical or configuration-related factors that disturb the balance of your test variations. Understanding these common causes helps prevent invalid results and ensures your experiment data remains accurate.
One of the most frequent reasons for Sample Ratio Mismatch is **uneven traffic allocation** due to bugs in the testing platform or experiment setup. Other causes include **tracking pixel errors**, **JavaScript loading issues**, and **browser caching problems** that prevent visitors from being correctly assigned to test groups. Additionally, **audience targeting filters**, such as device type or geographic segmentation, can unintentionally block some users, creating an **imbalanced sample distribution**. Even minor differences in how visitors are counted can produce statistically significant mismatches in A/B test data.
By identifying and addressing these causes early, you can maintain the **integrity of your A/B testing process**. Regularly auditing your **experiment setup**, verifying tracking accuracy, and using a reliable Sample Ratio Mismatch Calculator will help detect and fix errors before they affect your results. This proactive approach keeps your conversion optimization data clean and trustworthy.
How to Fix a Sample Ratio Mismatch
Fixing a Sample Ratio Mismatch (SRM) is essential for keeping your A/B testing data accurate and reliable. When SRM occurs, it usually means there’s a technical or setup issue causing traffic to flow unevenly between variations. By carefully reviewing and correcting these issues, you can restore balance to your experiment results and ensure your tests provide meaningful insights.
Check Experiment Setup
Begin by reviewing your entire experiment configuration inside your A/B testing tool. Make sure the traffic allocation ratio matches your original plan (for example, 50/50). Any misconfiguration or coding error can easily lead to an SRM. Double-check targeting conditions, audience filters, and campaign rules to confirm everything is properly aligned.
Verify Tracking Scripts
Incorrect or incomplete tracking scripts are one of the most common causes of Sample Ratio Mismatch. Verify that all analytics tags, pixels, and tracking codes are loading correctly on every page variation. A missing or delayed script can prevent visitor data from being recorded accurately, resulting in uneven sample counts. Always test your tracking setup using browser developer tools or analytics debuggers.
Avoid Overlapping Tests
Running multiple experiments on the same audience at once can create overlapping conditions, leading to an SRM issue. When two or more tests target the same user segment, it can distort the expected traffic distribution. Schedule tests sequentially or use mutually exclusive audience groups to ensure that each experiment receives clean, isolated traffic data.
Use Server-Side Testing Tools
If you frequently encounter Sample Ratio Mismatch problems, consider switching to a server-side A/B testing solution. Unlike client-side tools, server-side testing ensures traffic is split before rendering, making the allocation process more stable and precise. This approach minimizes errors caused by browser caching, script delays, or ad blockers, helping you achieve more accurate and consistent test results.
Implementing these best practices reduces the risk of SRM and keeps your conversion optimization experiments statistically sound. Consistent monitoring with a reliable Sample Ratio Mismatch Calculator helps maintain data integrity and builds confidence in your decision-making process.
Frequently Asked Questions (FAQ)
1. What is a Sample Ratio Mismatch (SRM) in A/B testing?
A Sample Ratio Mismatch (SRM) occurs when the actual traffic distribution in an A/B test doesn’t match the expected ratio. For example, if you planned a 50/50 split but received 60/40, it means the test setup has an imbalance that could make your results statistically invalid.
2. How do I detect a Sample Ratio Mismatch?
You can easily detect an SRM using a Sample Ratio Mismatch Calculator. Enter your expected and actual visitor counts, and the tool runs a Chi-Square test to check if the difference is statistically significant. If the p-value is below 0.05, it indicates a clear Sample Ratio Mismatch.
3. What causes a Sample Ratio Mismatch in experiments?
Common causes include tracking script errors, uneven traffic allocation, audience overlap, and randomization bugs in testing tools. Even minor technical issues can disrupt how visitors are assigned to variations, creating inaccurate A/B test results.
4. Why is it important to fix SRM before analyzing test results?
Fixing an SRM issue ensures your A/B testing data is accurate and statistically valid. If SRM is ignored, the test may show false winners or misleading conclusions, which can negatively impact conversion optimization and overall business decisions.
5. How can I prevent Sample Ratio Mismatch from happening?
To prevent SRM, always verify your tracking setup, ensure even traffic distribution, and avoid running overlapping experiments. Regularly test your configuration using a reliable SRM Calculator before launching any major experiment.
6. Does Sample Ratio Mismatch affect statistical significance?
Yes, a Sample Ratio Mismatch directly affects the statistical significance of your experiment. Because the sample distribution is unbalanced, your A/B test results may not represent the true performance difference between variants, leading to unreliable insights.